Tesla (TSLA) has been one of the strongest performing US stocks over the past few months, rallying over 150% from the beginning of September 2019 to its current share price at US$569.56. In doing so, it has reached a market capitalisation in excess of US$100 billion.
Amazingly, it is now the largest US automaker, in terms of stock valuation, of all time, surpassing the likes of Ford and General Motors. While the company still has plenty more to do to reach that of Toyota, the largest global automaker (market capitalisation of approximately US$230 billion), considering the relatively small amount of cars Tesla has sold, investors are clearly valuing the company on spectacular future growth.
It was not that long ago that many market watchers were suggesting that Tesla was on the verge of bankruptcy. However, in just a short space of time, we are now seen analysts with price targets north of US$1000 a share in the years to come. With such conflicting views, how does one make an educated judgement to be holding Tesla in their portfolio?
One method that can be a useful addition to any investor’s toolbox is trend analysis. Put simply, instead of relying on the view of market analysts, we first define the direction of the trend using objective methods, and the secondly, limit our exposure to those times when the trend is up. Combined with fundamental analysis, this can be a useful way for investors to time both the entry and exit into a stock they like.
One of the free tools available on the Rivkin website does just that. Our ‘US Up Trending Stocks’ table not only identifies when a stock has entered an uptrend, but also when that trend has finished.
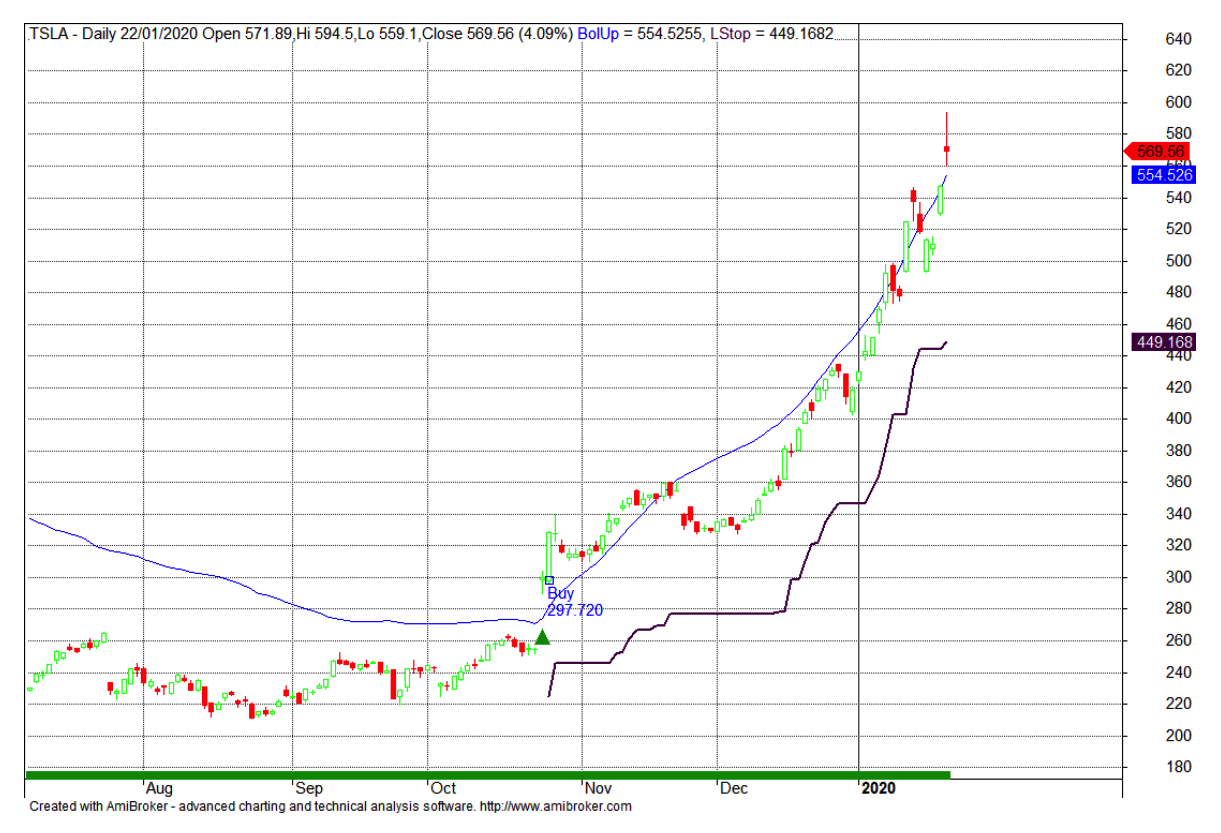
As shown on the chart below, TSLA triggered an uptrend back in late October, with the price opening the following day at US$297.72. While trend analysis will not pick the absolute low, in the case of Tesla, it has clearly captured a large chunk of the most recent rally. More so, as at current levels, we determine the trend to remain in place, while ever the price is above US$449.17, the trailing stop loss.
Rivkin’s table of US Up Trending Stocks covers all S&P100 and Nasdaq100 stocks, and is updated on a daily basis, meaning each day, we alert our followers to which stocks have entered a new uptrend, and also the stocks whose trend has ended.
You can access US Up Trending Stocks page HERE and you can subscribe by pressing the bell button on the left hand side.

