ASX Event Performance
How Performance Is Calculated
ASX Event Picks are individual opportunities (takeovers, mergers, corporate events). We don’t stay fully invested all the time, so performance is measured per trade, not as a portfolio.
What We Track Per Trade
Metric |
What It Shows |
|---|---|
| Total Number of Trades | How many ASX Event Trades do we execute each year |
| Profitable Trade Ratio | % of trades that returned a profit |
| Average Days in a Trade | How long we held each trade (average) |
| Average Return per Trade | Average return earned on each trade |
| Best Trade | The highest-returning trade in that year |
| Worst Trade | The lowest-returning trade in that year |
Trade Stats
All stats are for closed trades since the 1st of January 2016.
| 2016 | 2017 | 2018 | 2019 | 2020 | 2021 | 2022 | 2023 | 2024 | 2025 | 2026* | 2016-2026* | |
| Total Number of Trades | 11 | 6 | 13 | 13 | 16 | 12 | 19 | 11 | 13 | 8 | 1 | 123 |
| Profitable Trade Ratio | 64% | 83% | 85% | 54% | 88% | 100% | 100% | 91% | 85% | 87.5% | 100% | 84.6% |
| Average Days in a Trade | 78 | 88 | 123 | 78 | 118 | 107 | 140 | 116 | 116 | 140 | 280 | 114 |
| Average Return per Trade | 3.09% | 2.38% | 5.94% | 1.36% | 5.15% | 12.86% | 6.93% | 4.68% | 2.51% | 2.25% | 9.34% | 5.07% |
| 2016 | 2017 | 2018 | 2019 | 2020 | 2021 | 2022 | 2023 | 2024 | 2025 | 2026 | |
| Worst Trade | -7.77% | -0.55% | -4.26% | -3.03% | -79.15% | 1.30% | 0% | -0.36% | -23.96% | -41.75% | 9.34% |
| Best Trade | 18.67% | 7.14% | 21.72% | 14.77% | 69.42% | 39.70% | 26.10% | 18.42% | 8.76% | 13.71% | 9.34% |
*Partial year
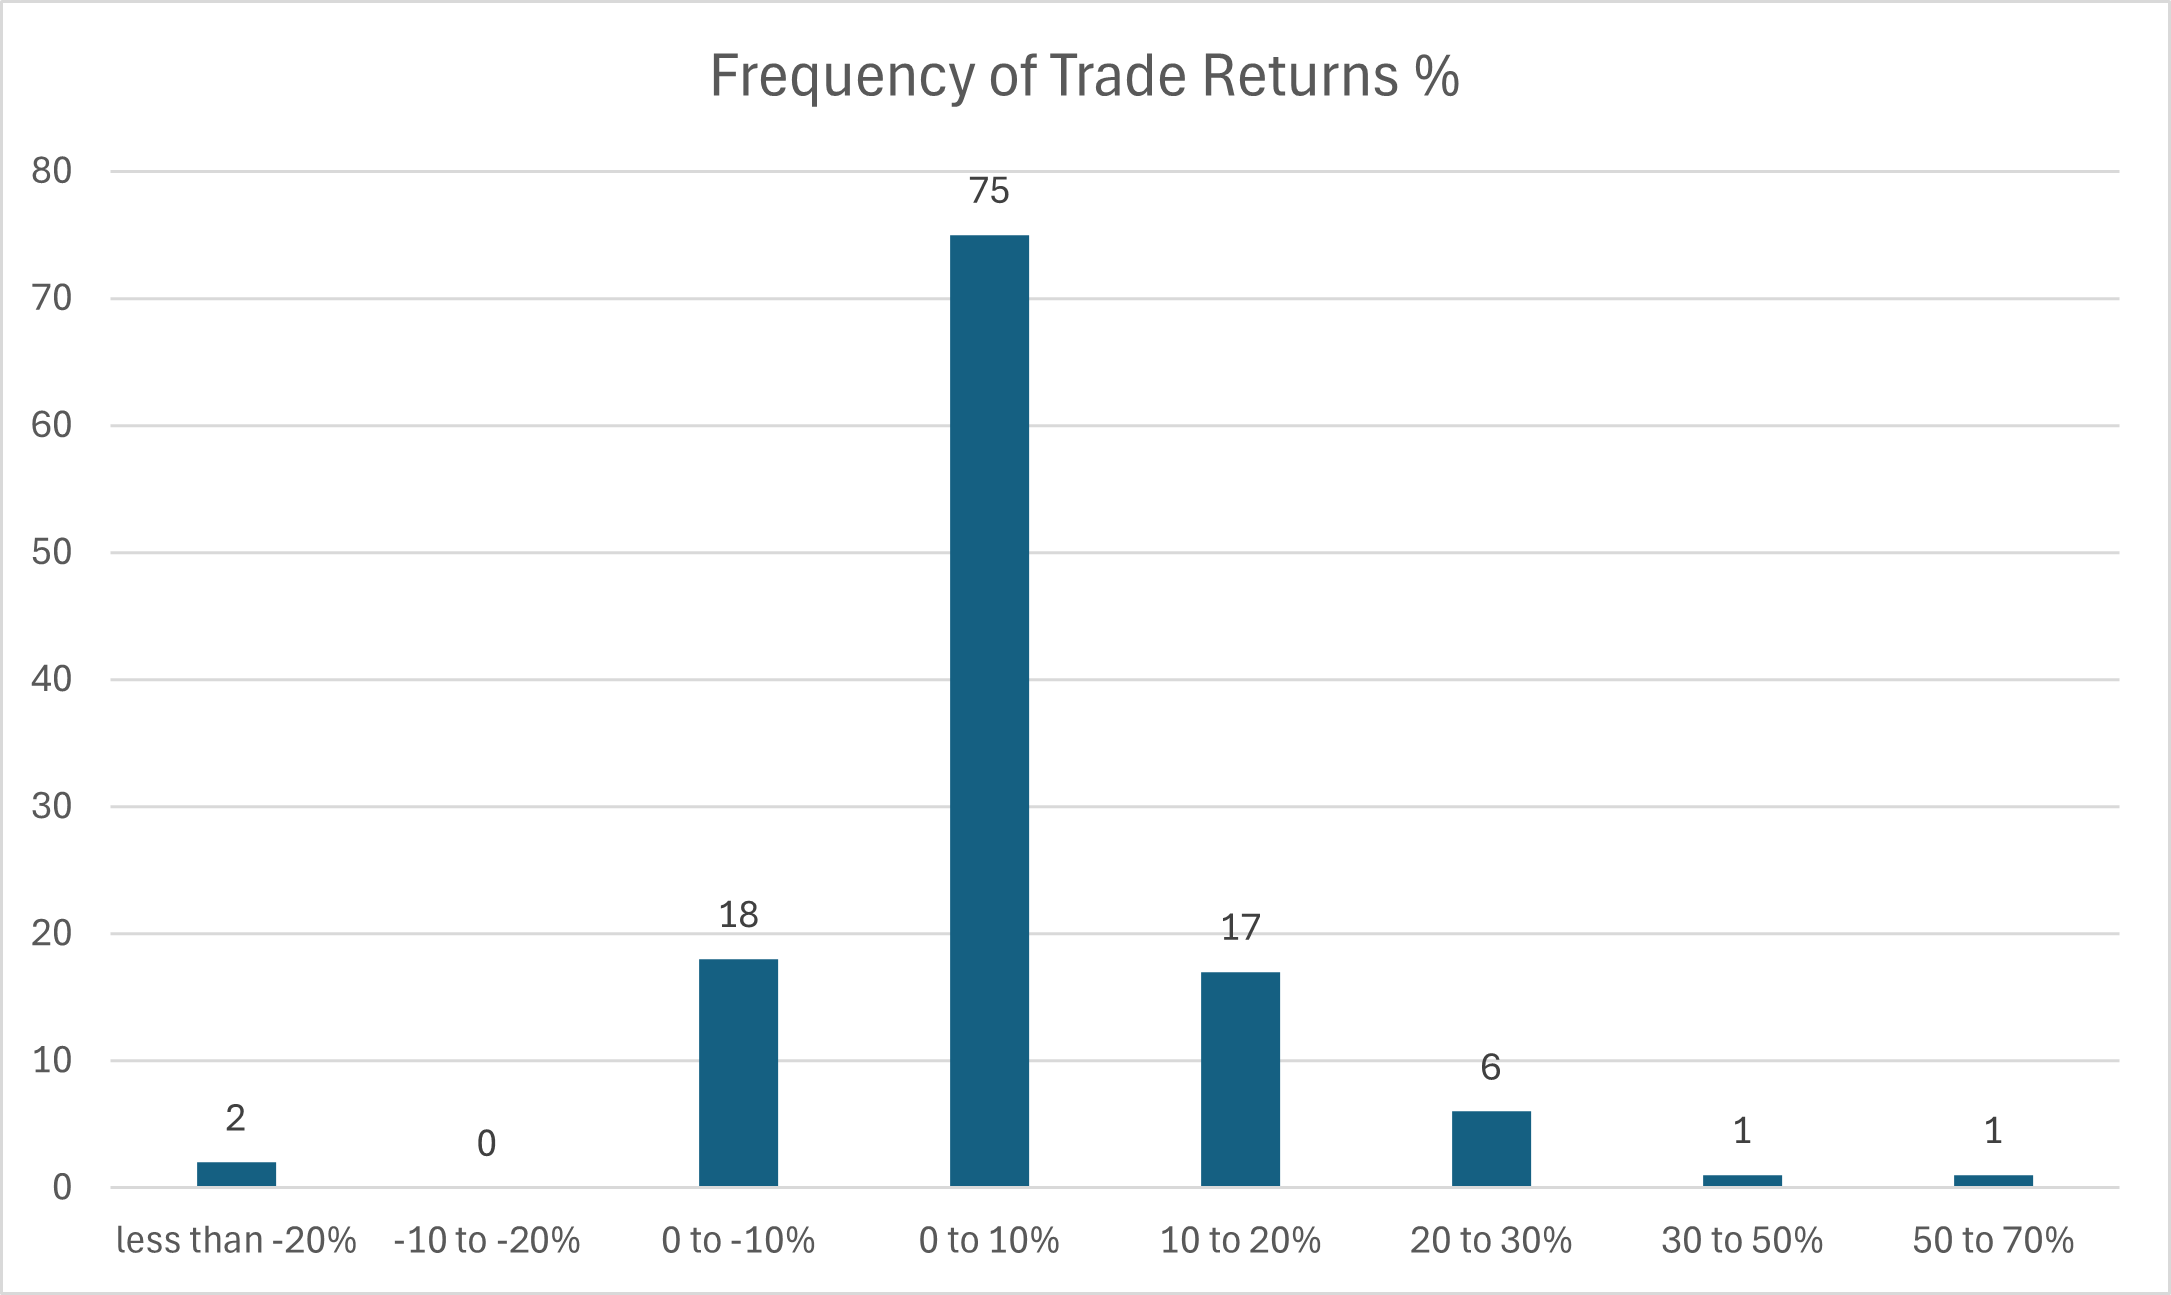
Distribution of Returns
Across the years:
- 11% of the trades resulted in a loss greater than 1%
- 78% of the trades resulted in a profit that is greater than 1%
- 24% of the trades resulted in a profit greater than 10%
This long tail in profitable trades is the reason this portfolio has one of the best risk-adjusted returns, within our portfolios.