Strategy Objective: The Rivkin Low Volatility Strategy aims to provide steady, stable returns, which have a low correlation to the broader equity market. The Strategy involves allocating equal weighting to four different asset classes, via ASX listed ETFs.
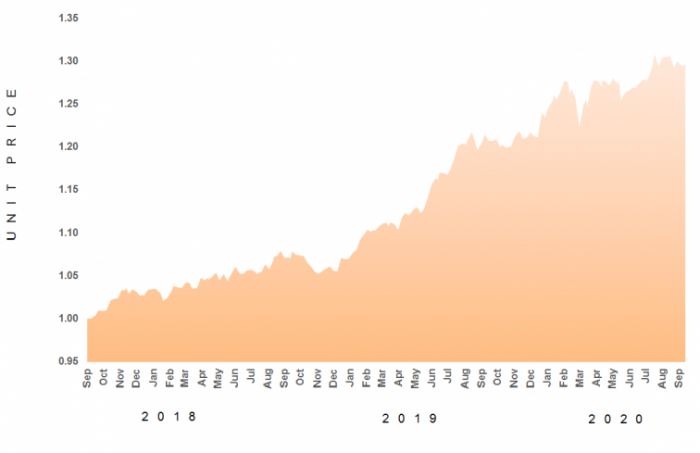
30 September 2020 Equivalent Unit Price – A$1.2961
Welcome investors to the monthly update for the Rivkin Low Volatility (LV) Strategy for September 2020. The LV strategy declined marginally in September, with the Equivalent Unit Price declining 0.70% to finish the month at 1.2961. Year-to-date, the LV strategy has gained 6.93%, net of fees, over the first nine months of the year.
| PORTFOLIOS | LOW VOLATILITY |
|---|---|
| Latest Month | -0.70% |
| QTD | 2.16% |
| Calendar YTD | 6.93% |
| Financial YTD | 2.16% |
| 12m | 7.09% |
| Inception | 29.61% |
Monthly Commentary
The decline in US equities was the largest detractor to performance for the month, however this was somewhat tempered by a declining Australian dollar. The Australian dollar gold price was also softer, however bonds rallied quite strongly. The Australian budget was handed down this week, which included bringing forward personal tax cuts, and a large infrastructure spending package. All in all, the Federal Government is prepared to provide ample fiscal support to get the economy back on track, the risk being an uptick in inflation in the years ahead. From the portfolio, stocks and gold would provide the best protection to an inflationary environment, while bonds would likely suffer.
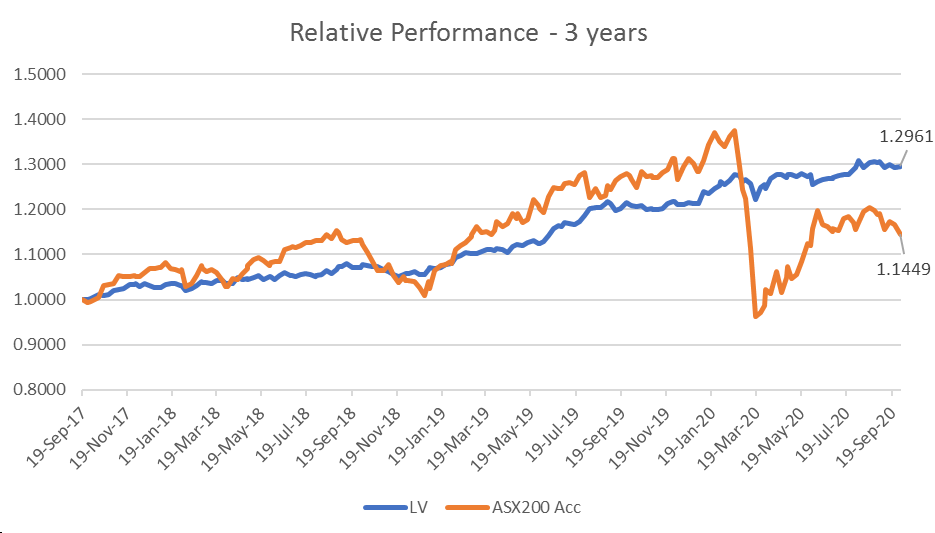
It has been three years since the Low Volatility portfolio was first introduced to wholesale clients, so we wished to provide a longer-term review of how the strategy has performed over this time. The first chart plots the equity curve of the LV strategy against the ASX200 Accumulation Index. Typically, over a 3-5 year investment horizon, we would expect the LV strategy to underperform a straight equities portfolio, and this would have been the case if not for the severe selloff earlier this year, brought on by the Coronavirus pandemic. While the total return net of fees of the LV portfolio has been 29.61%, the ASX200 Accumulation Index has returned 14.49% over the corresponding period.
Chart 1: 3-year Performance Comparison.
While the past three years have provided a solid return, it is this return relative to the volatility/risk which is important. What attracts many of our investors to the LV portfolio is the low volatility (no pun intended), which we believe is best demonstrated in two ways, the first being the drawdown from the high water mark, and the second being the distribution of monthly returns.
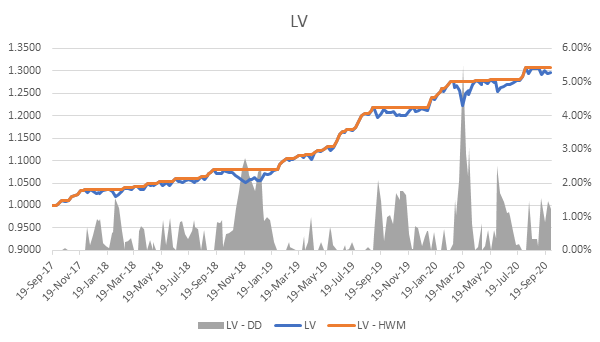
The drawdown is the amount, expressed as a percentage, that the strategy declines from the high-water mark, at any point in time. It is an important measure of risk, as it relates to the ‘comfort level’ of an investment strategy. The shallower the drawdown, the easier a strategy is to follow, as investors are less exposed to a declining capital value, even though that decline has not been crystalised. The below chart plots the performance of the LV strategy is blue, the high-water mark of the strategy in orange, and the drawdown in grey, on the right-hand side axis. As shown, the deepest drawdown experience over the past three years occurred in March 2020, at a time when equity markets were falling heaving. The peak drawdown was 5.49%.
Chart 2: LV Equity Curve, High Water Mark, and Drawdown.
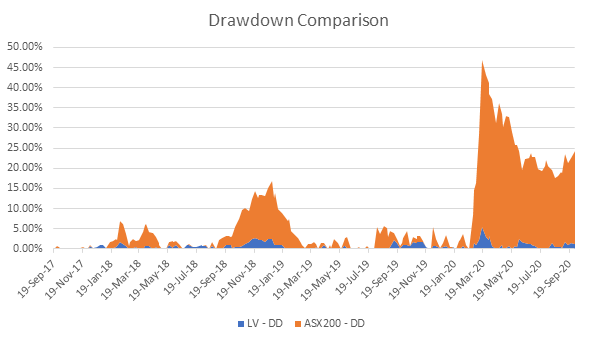
To demonstrate how this differs from a straight equities portfolio, for which we are using the ASX200 Accumulation Index as a proxy, we can see that equities at the same point experienced a drawdown of 41.3%. Chart 3 below, plots the drawdown levels for both the LV strategy and the ASX200 Accumulation Index over the past three years. Not only was the peak drawdown for LV markedly less, but the strategy has held its value much better than equities at any other points in time as well.
Chart 3: Drawdown Comparison
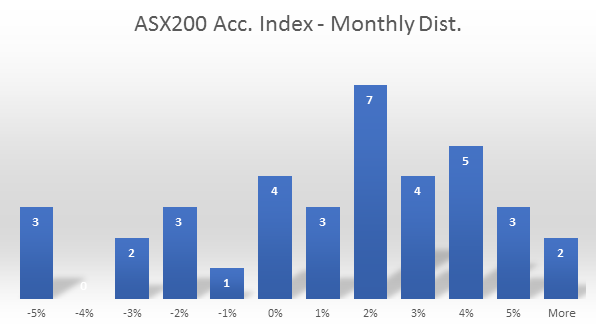
The second way in wish to demonstrate the low volatility nature of this portfolio is to look at the distribution of monthly returns over the past three years, and again compare this to those of the ASX200 Accumulation Index. For the LV strategy, the distribution of monthly returns can be seen below. Since September 2017, there have been 13 months with a negative return, the worst month being -0.91%. Compared to the ASX200 Accumulation Index, which has also had 13 negative months over this times, however considerable worse in size, with the largest monthly decline of -20.65%.
Chart 4: LV Monthly return distribution
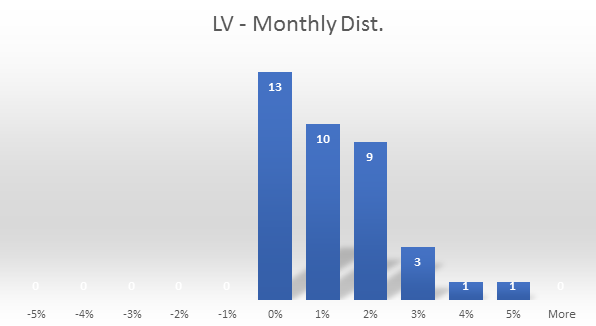
Chart 5: ASX200 monthly return distribution
In summary, the believe the past three years demonstrate that the Low Volatility portfolio is doing as intended, by providing considerable better risk adjusted returns than straight equities.
If you have any questions regarding the above or your investments with Rivkin in general, please call us on 02 8302 3605.
Monthly Returns
Performance
NAV Price Chart
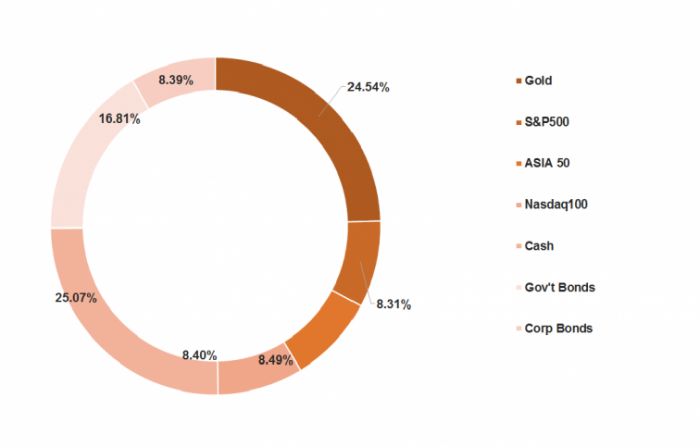
Portfolio Composition
Asset Class Weighting
Strategy Description and Information
The low volatility strategy invests in listed ASX securities (ETFs) that represent multiple asset classes: cash, US equities, bonds and gold. We target asset classes that have a low or negative correlation to each other, with the benefit being a history of lower volatility and higher risk-adjusted returns than equities alone. While the expected return of this strategy will be lower than the long-term average of equity returns, the superior return per unit of volatility makes this an excellent tool to offset some of your more volatile investments. Both the gold and US equity ETF are unhedged, meaning that approximately half the portfolio has exposure to a short AUD/USD position. Given the nature of the AUD as a growth currency to decline during periods of equity market declines, this exposure is advantageous to cushioning the portfolio during periods of equity market weakness.
Important Disclaimer
The Rivkin Low Volatility Strategy is available to wholesale investors only. Past performance is not a reliable indicator of future performance. The value of your investment may rise and fall, and you may not receive the amount originally invested.
Contact
Thomas Silitonga – Director, Rivkin Asset Management
[email protected] – +612 8302 3605

