Before buying a stock, most investors check a short list of ratios covering valuation, profitability, income and leverage. No single figure settles the question, so the ratios work best read together, compared with peers in the same industry and against the company’s own history.
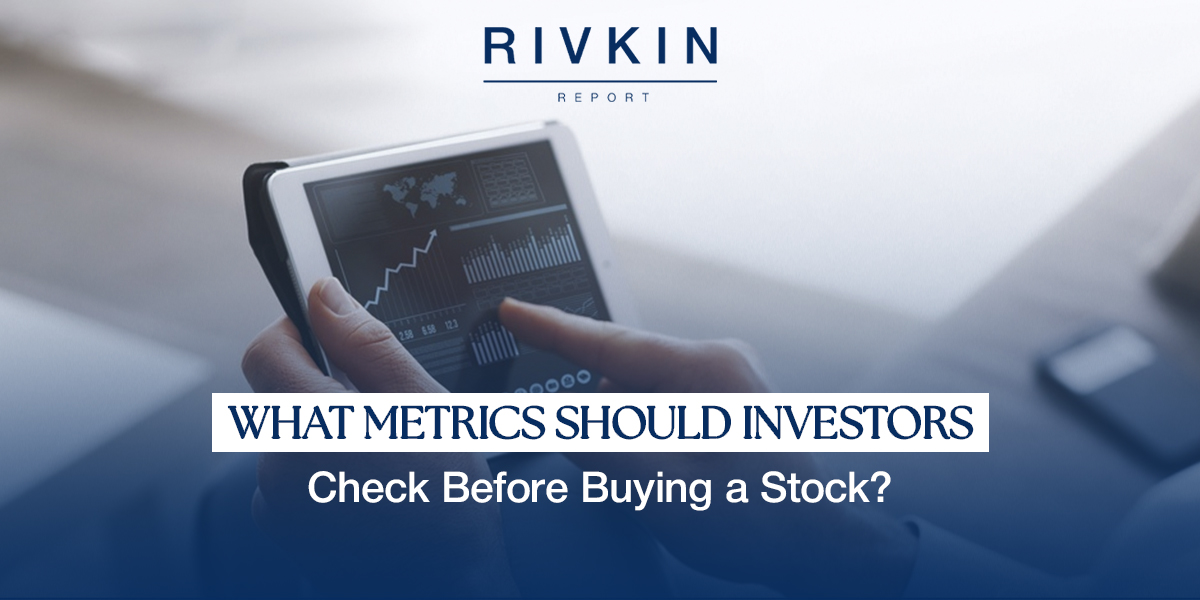
Every listed company publishes a steady stream of financial data, and a handful of ratios do most of the work, each answering a different question about the business. It is a bit like inspecting a used car: the odometer and the service history each tell you something useful, though neither tells the whole story on its own.
The Starting Point: Key Stock Valuation Metrics for Investors
The price-to-earnings (P/E) ratio divides the share price by earnings per share, so a P/E ratio of twenty means investors are paying $20 for every $1 of annual earnings. What counts as reasonable varies by industry and growth stage, which is why a P/E of 20 can look expensive for a utility and modest for a fast-growing software company.
The price-to-book ratio compares the share price with net assets per share. It carries more weight for banks and property companies than for technology firms, where much of the value sits in people and intellectual property that the balance sheet doesn’t capture.
Profitability and Income: Financial Ratios to Analyse a Stock
Return on equity (ROE) divides net profit by shareholders’ equity and shows how much profit the business earns on its owners’ capital. High debt and share buybacks both shrink the equity base and lift the ratio, so it is worth checking whether a high ROE comes from the business itself or from its balance sheet.
Earnings per share (EPS), net profit attributable to ordinary shareholders divided by the weighted average number of shares on issue, shows whether profit per share is growing and sits underneath the P/E ratio.
Dividend yield is the annual dividend as a percentage of the share price, and a high yield can reflect a falling share price as easily as a strong income stream. For Australian shares, a fully franked net (cash) yield of 4% grosses up to about 5.7% (4% ÷ 0.7), though the gross figure overstates the income for anyone who can’t use the full franking credit.
How to Evaluate a Stock Before Buying
We think six metrics make a sensible starting checklist for researching a company.
Price-to-Earnings Ratio
Shows how expensive a stock is relative to current profit, and can’t be calculated for a loss-making company.
Price-to-Book Ratio
Most useful for banks, insurers and property businesses, and less so for asset-light companies.
Return on Equity
Best read over several reporting periods, since a single strong result can flatter it.
Debt-to-Equity Ratio
Compares interest-bearing debt with equity, though some platforms use total liabilities, so check the definition.
Dividend Yield
Best read alongside the payout ratio and franking level rather than on its own.
Earnings Per Share Growth
Shows whether profit per share is rising over time, which matters more to a long-term holder than one period’s result.
The Rivkin Report applies this kind of analysis across ASX and US-listed companies, for investors looking to invest in US shares from Australia, its US Growth portfolio uses a rules-based approach combining value and momentum.
Growth-Focused Metrics Worth Adding to the Checklist
For faster-growing companies, investors often add the price-to-earnings growth (PEG) ratio, which divides the P/E by the expected earnings growth rate. A P/E of 30 with earnings forecast to grow 30% a year gives a PEG of 1, though the result is only as reliable as the forecast behind it. Comparing revenue growth with earnings growth over several years also shows whether sales are turning into profit.
What Makes a Stock a Good Investment? Reading the Metrics Together
No single ratio tells the full story. A low P/E might point to an undervalued company or to a business in decline that the market has priced accordingly, so pairing P/E with ROE and then checking debt-to-equity gives a fuller picture. Comparisons work best within the same industry, and the numbers still need context on management quality and competitive position, which a balance sheet can’t capture.
Where to Find This Data
The figures come from annual and half-yearly reports, which are free on the ASX announcements platform for every listed business. Check the reporting date behind any ratio, since older results may not reflect a recent acquisition or capital raising.
Frequently Asked Questions
Is a low price-to-earnings ratio always a buying opportunity?
Not necessarily. It can reflect undervaluation, or a business whose problems the market has already priced in.
Can Australian investors access the same metrics for US shares?
Yes. US companies file annual (10-K) and quarterly (10-Q) reports with the SEC, and most Australian broking platforms show the same ratios for US shares.
How many metrics should I check before buying a stock?
There is no fixed number, though covering valuation, profitability, income and leverage gives a reasonably complete picture.
Do these metrics apply equally to every sector?
Not entirely. Banking and property lean more on price-to-book, while growth sectors lean more on earnings and revenue growth.
What metrics should I look at before buying a stock?
P/E, return on equity, debt-to-equity, and dividend yield form the core checklist, with revenue growth and free cash flow adding depth.
Should beginners focus on fewer metrics to start with?
Starting with P/E, dividend yield, and debt-to-equity gives a balanced first read, and other measures can follow with experience.
The Practical Read
Reading a small set of ratios together gives a firmer basis for assessing a stock than price moves or headlines alone, since a company that looks cheap on one measure can look far less appealing once profitability and debt are taken into account.
The Rivkin Report covers companies across the share market in Australia and US exchanges, with model portfolios and alerts by email or SMS. Investors can start a 14-day free trial, with no card required.
General Advice Warning: This information is general advice only, prepared by Rivkin Securities Pty Ltd (AFSL 332802) without considering your objectives, financial situation, or needs. Before acting, consider its appropriateness to your circumstances and review relevant PDS/TMD documents. Investing involves risk, including loss of capital. Past performance is not a reliable indicator of future results.
Tax Disclaimer: Tax information is general and based on ATO guidance. Rivkin does not provide tax advice. Consult a registered tax agent before acting.